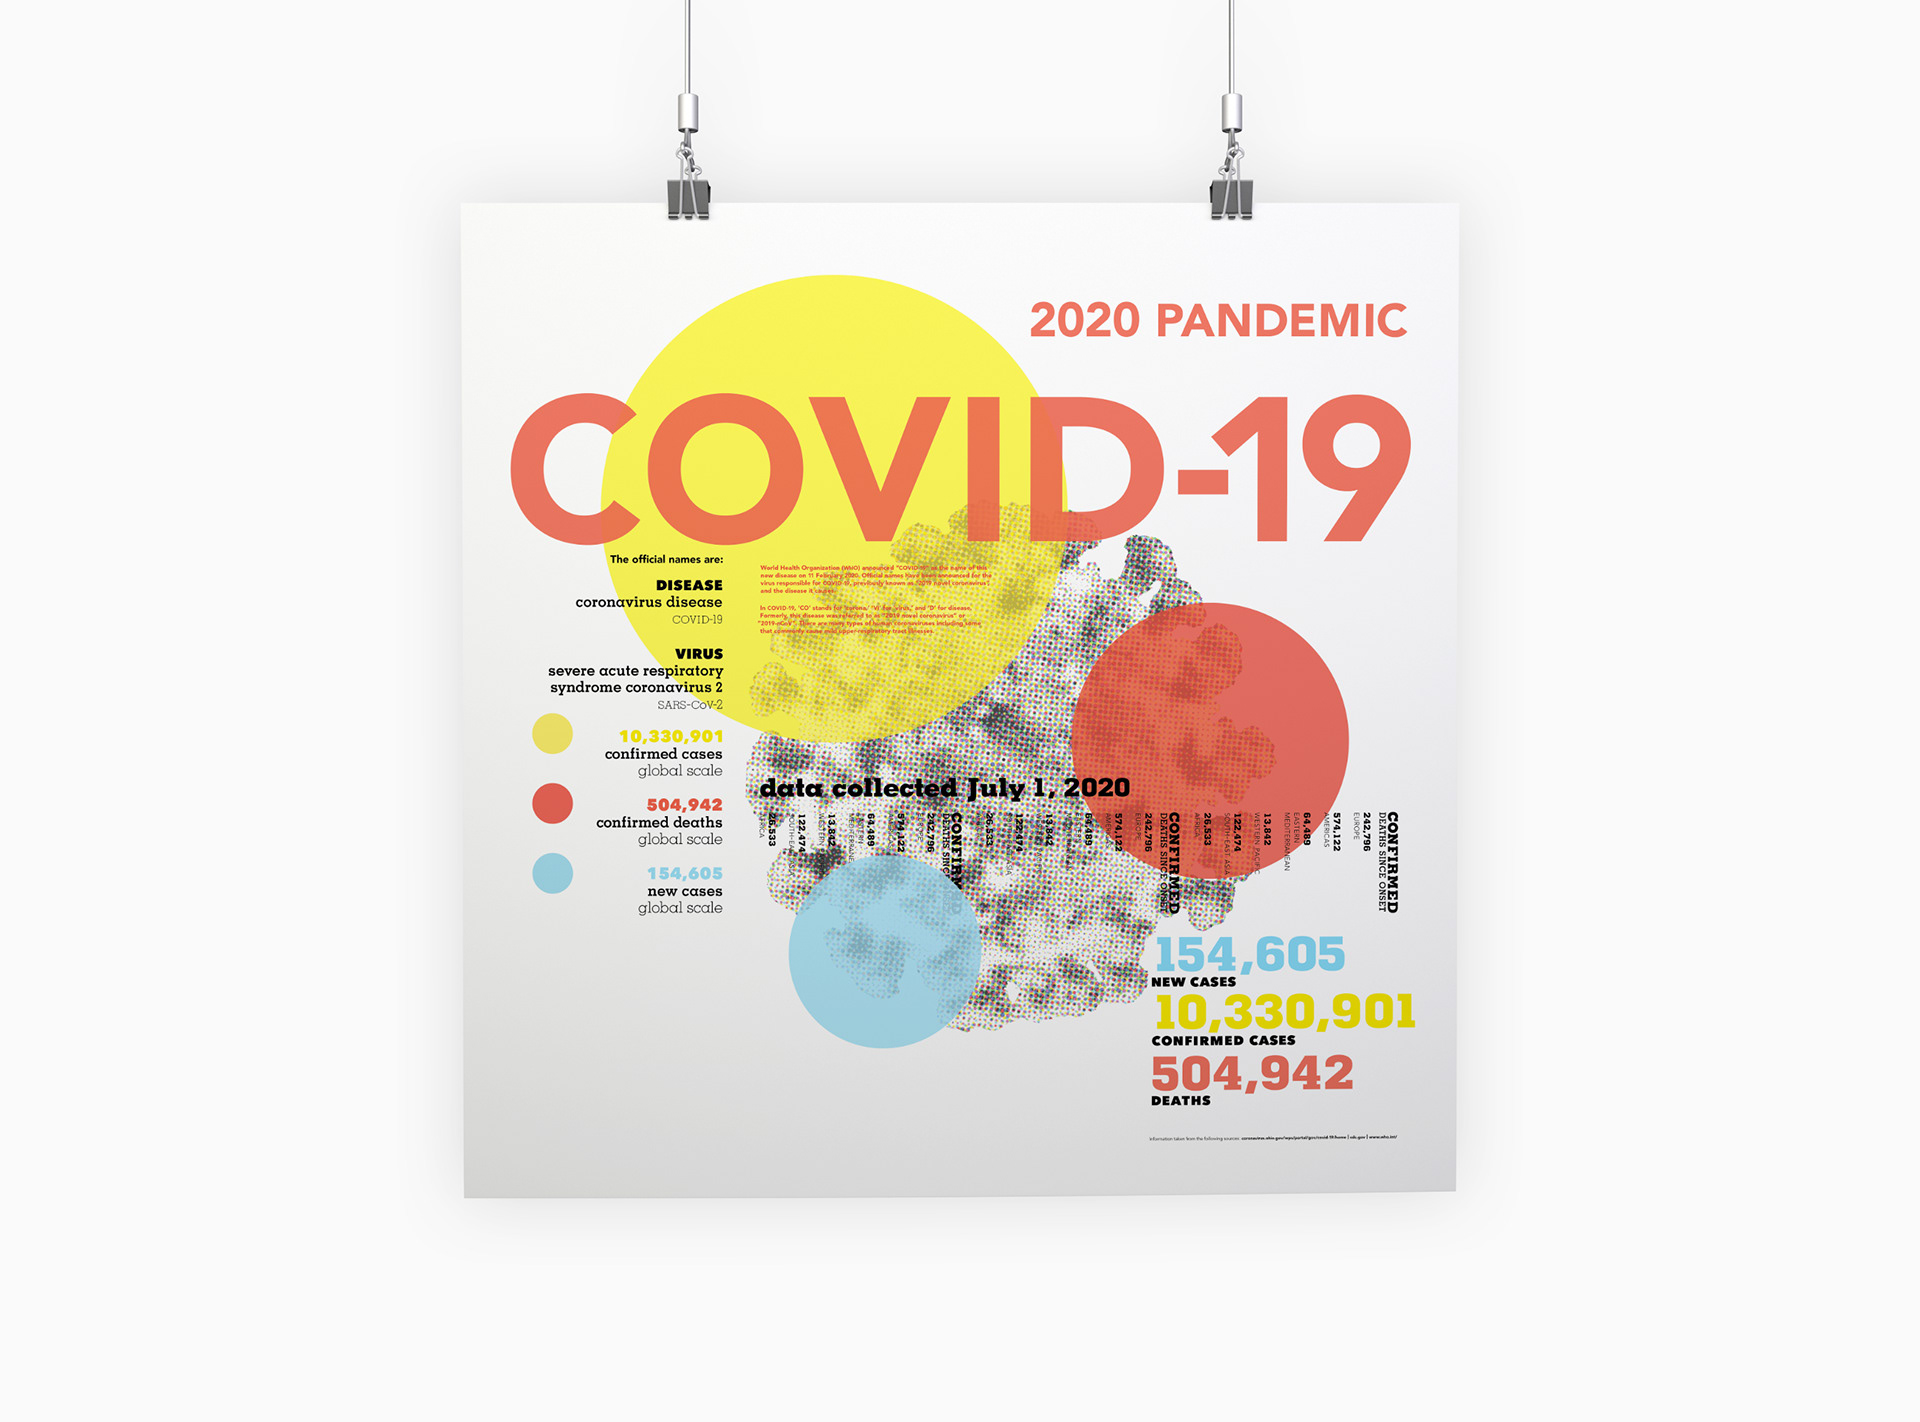
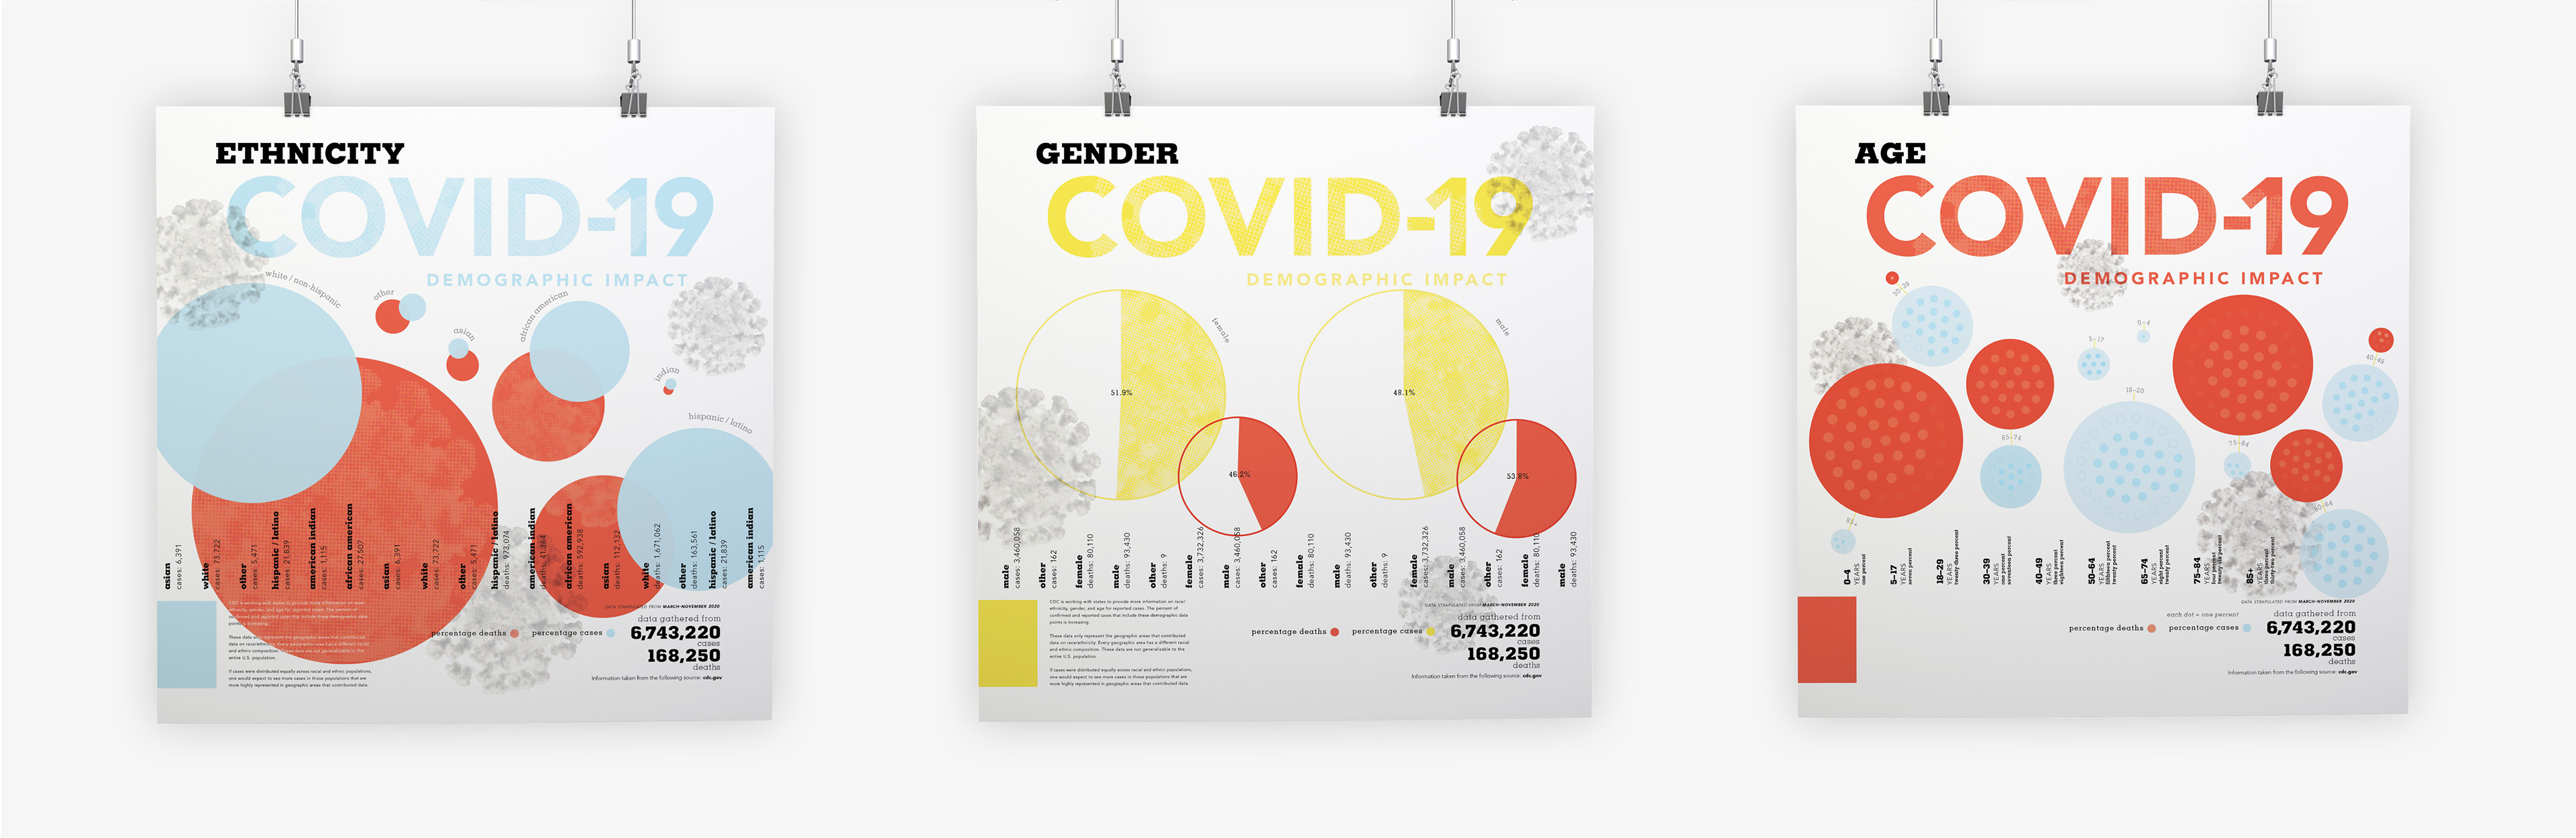
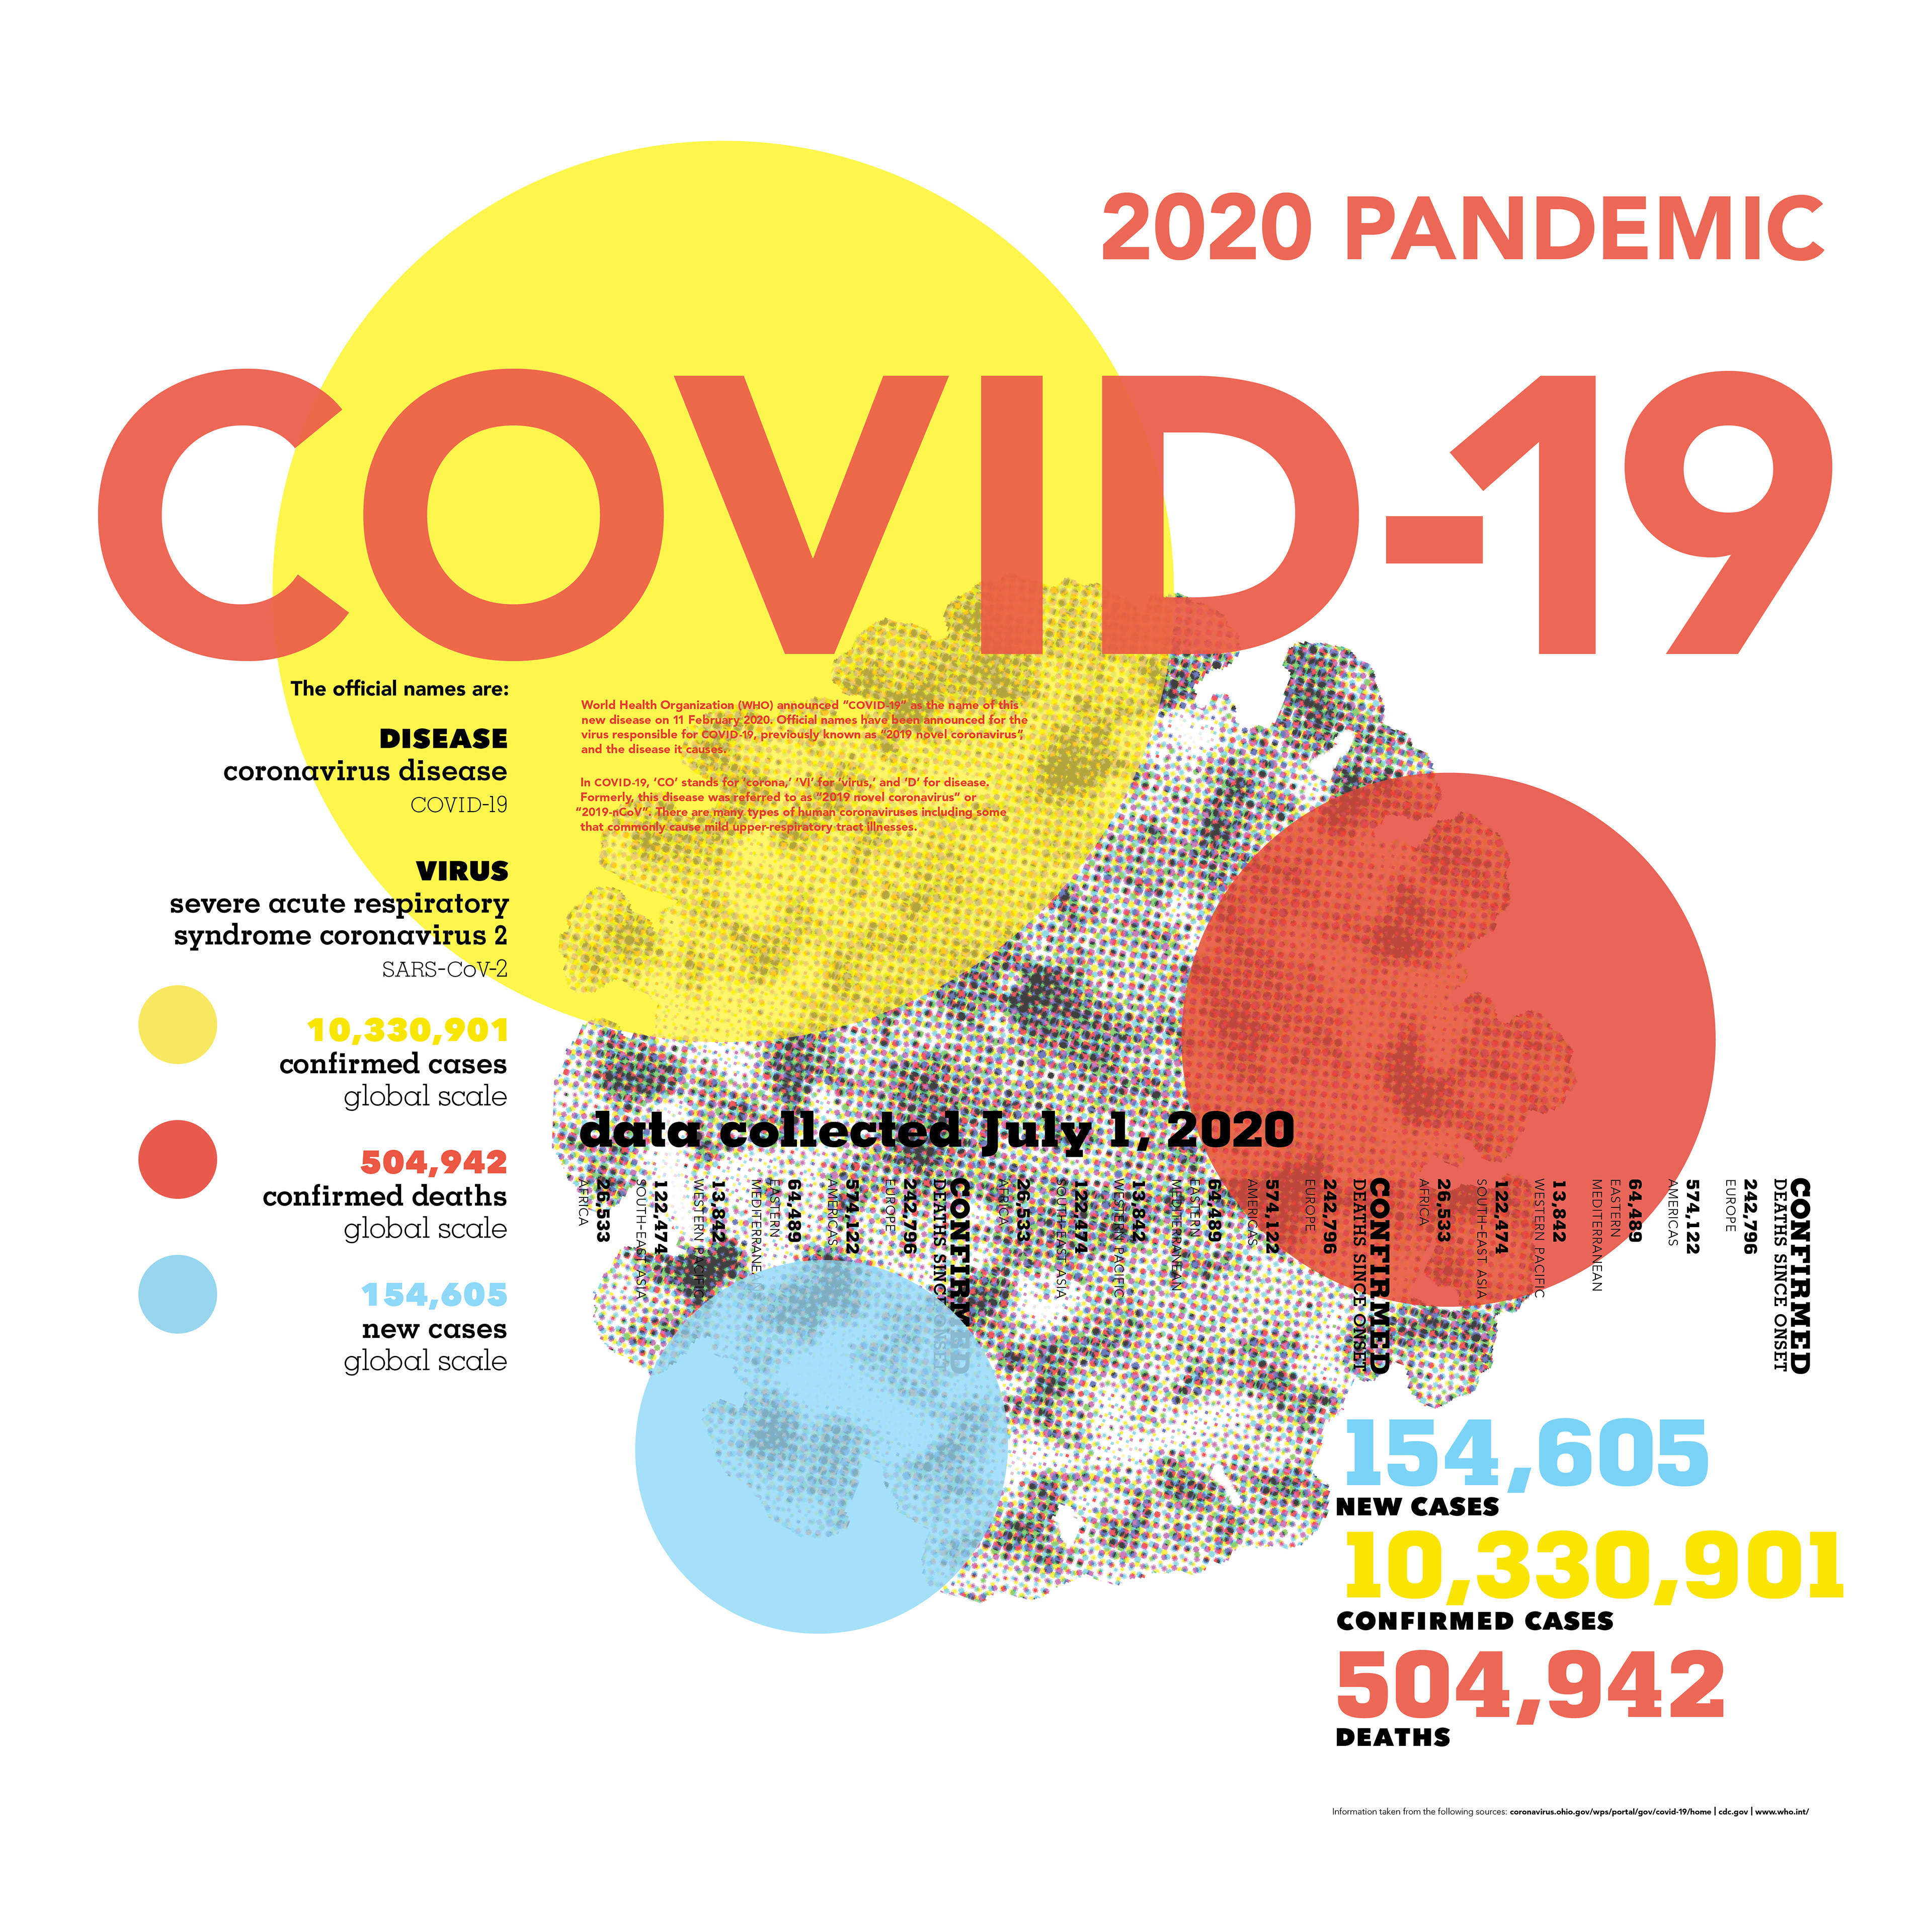
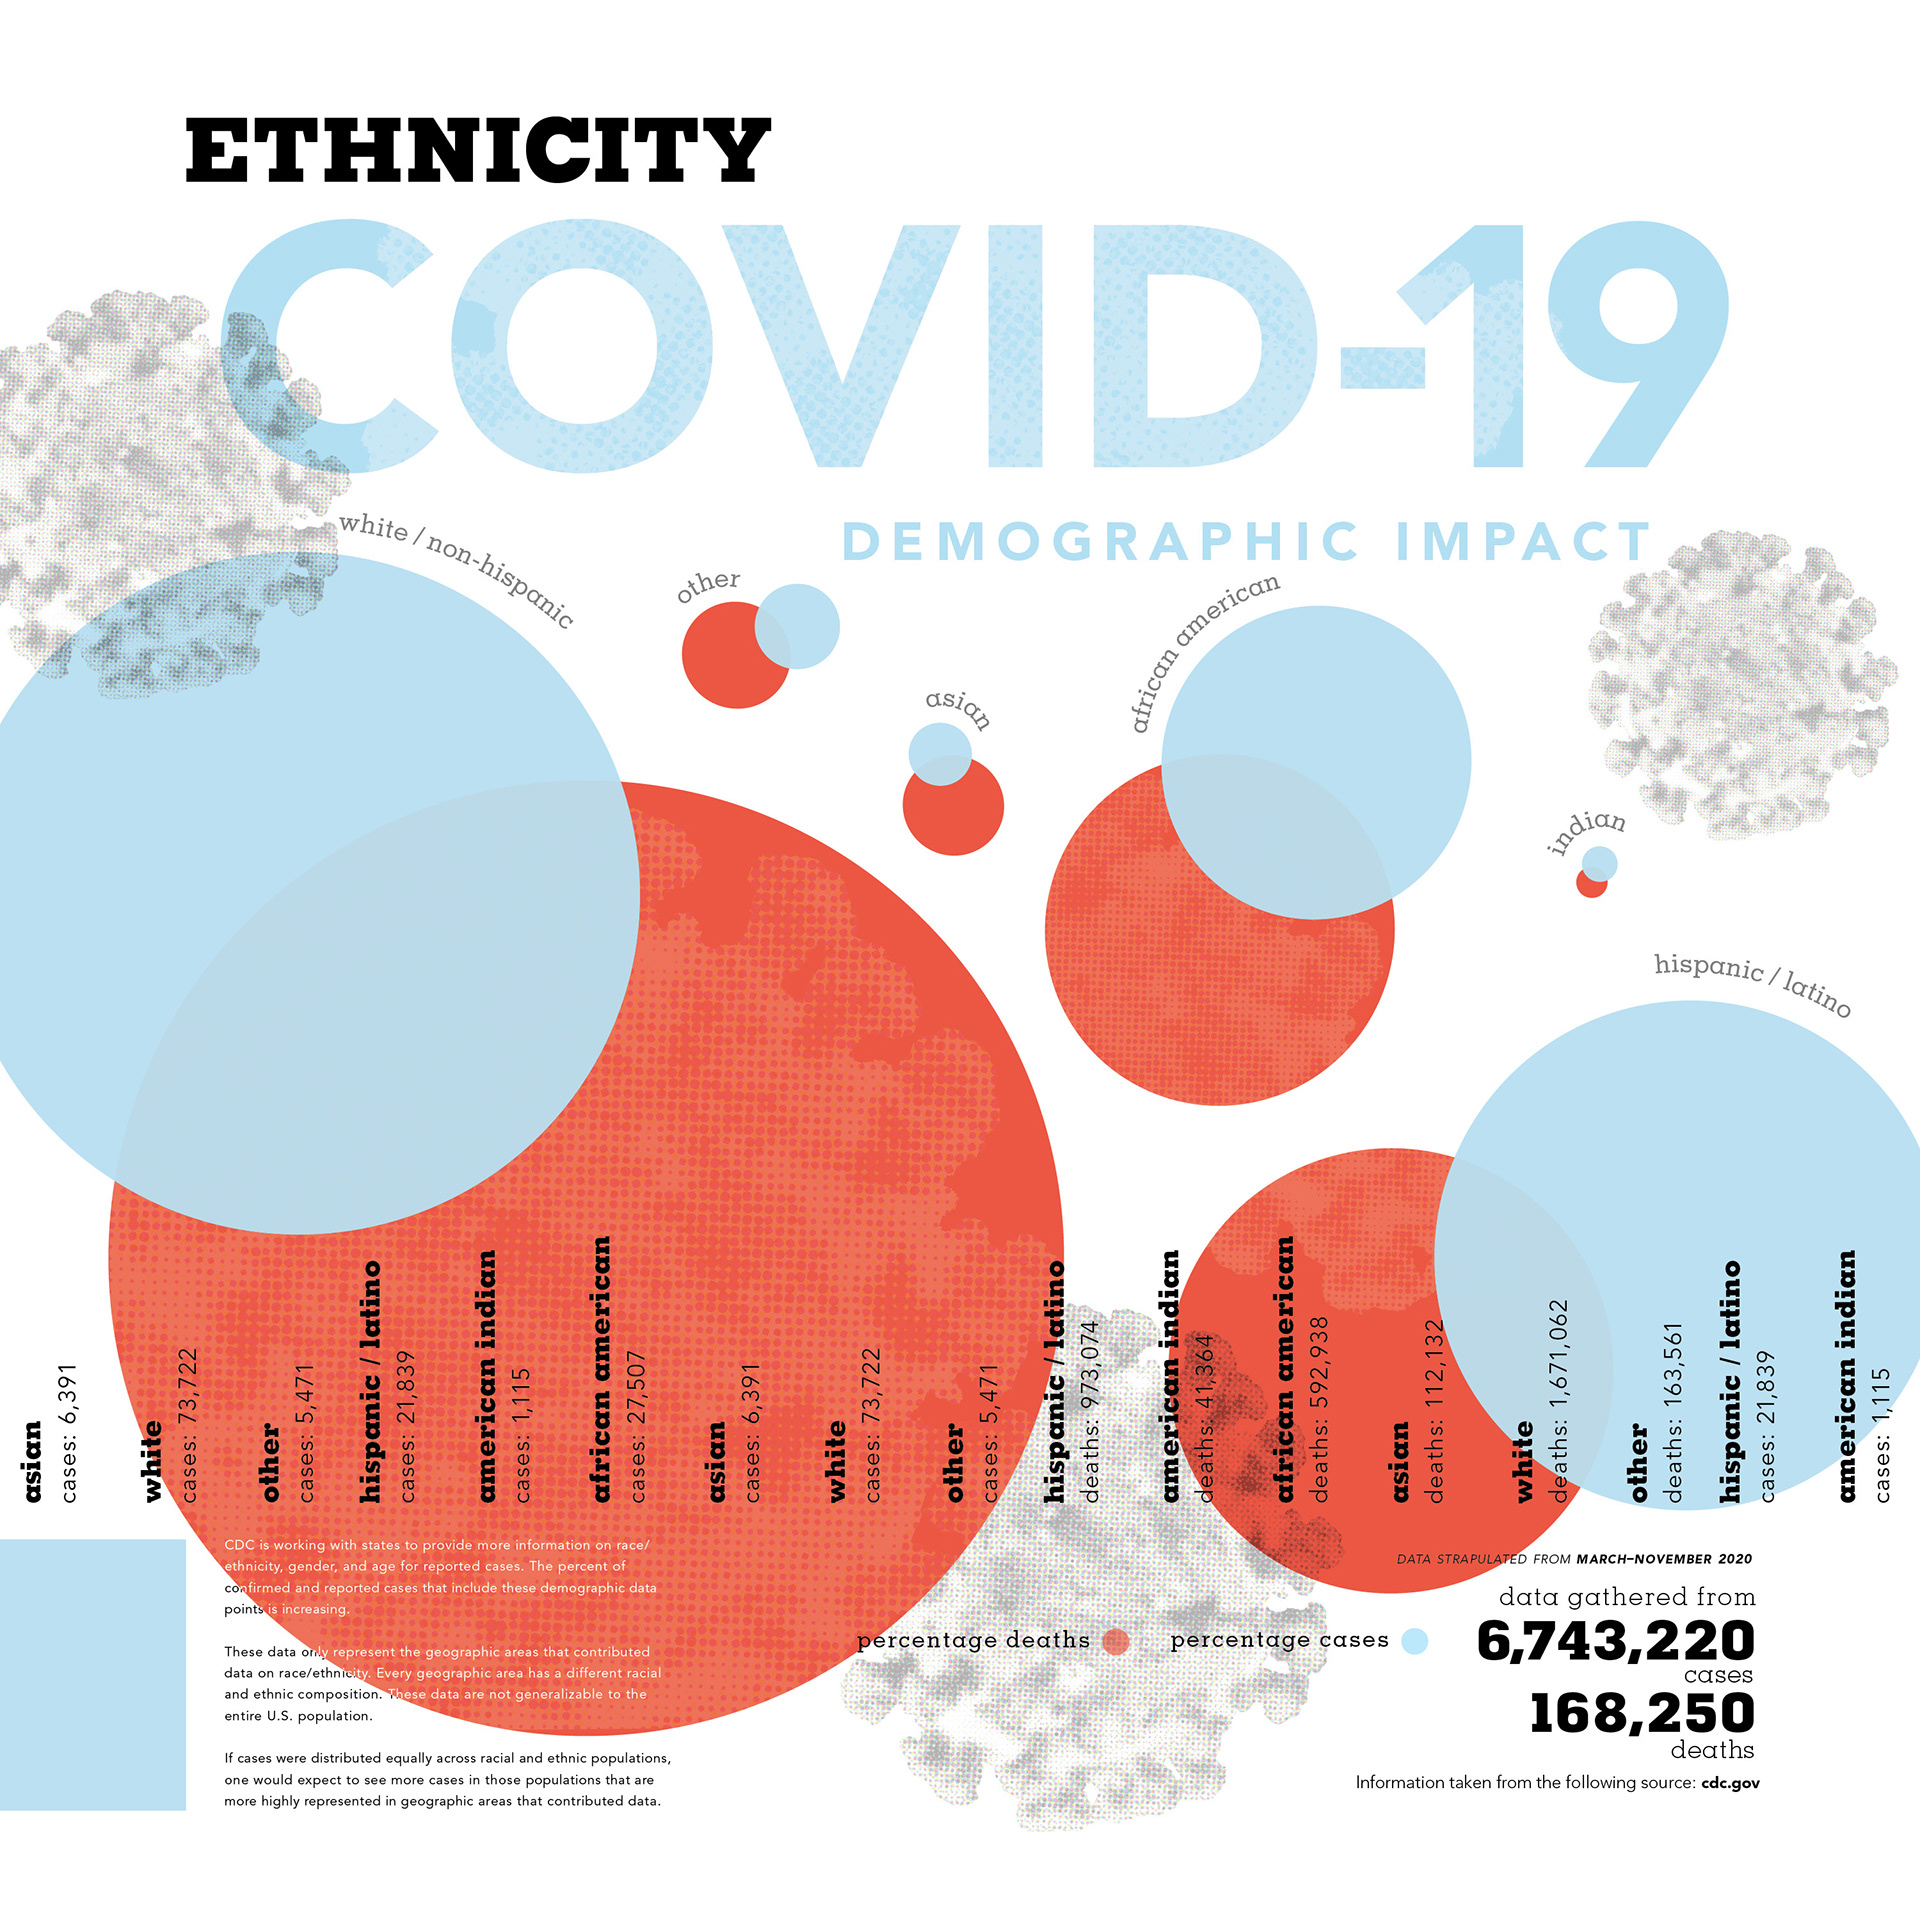
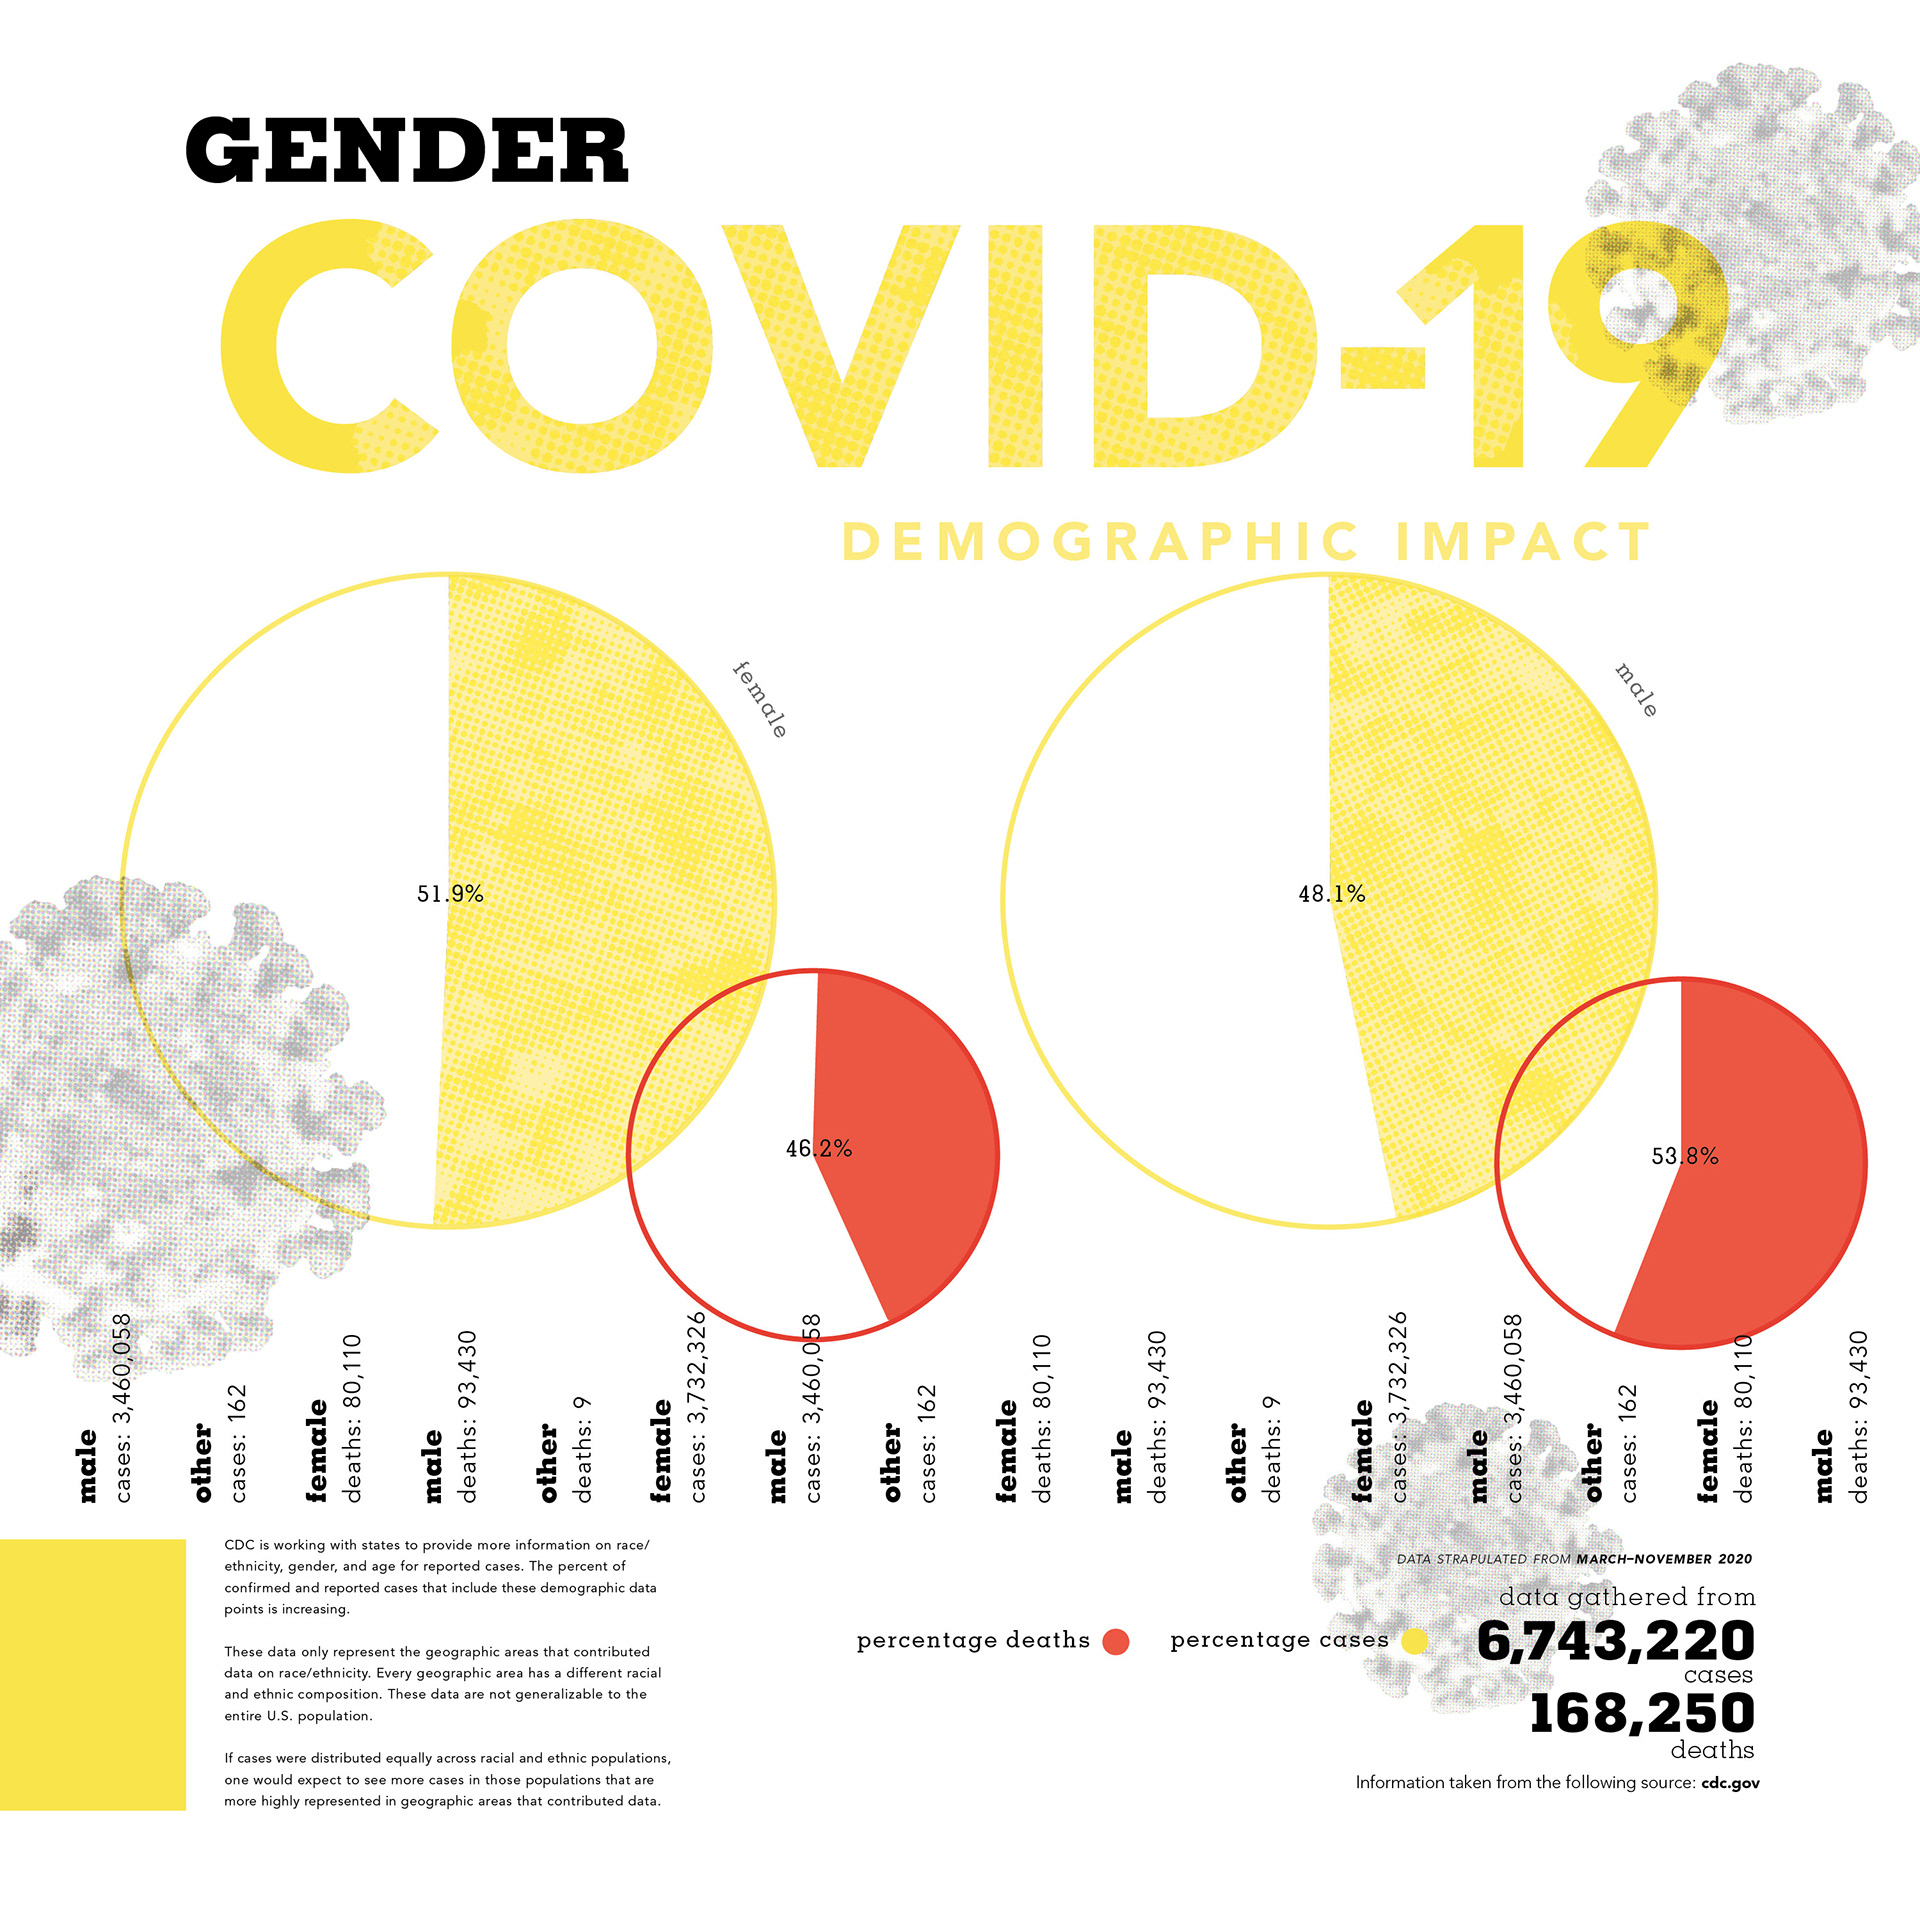

Independent study investigating data visualization and interactive media. Developed a series of posters that depict data trends over a six month period March–August of 2020. Utilized the interactive PDF function of Adobe Indesign to create dynamic, animated posters. Created a subset of posters investing the pandemic’s impact on the three demographics age, ethnicity, gender.