
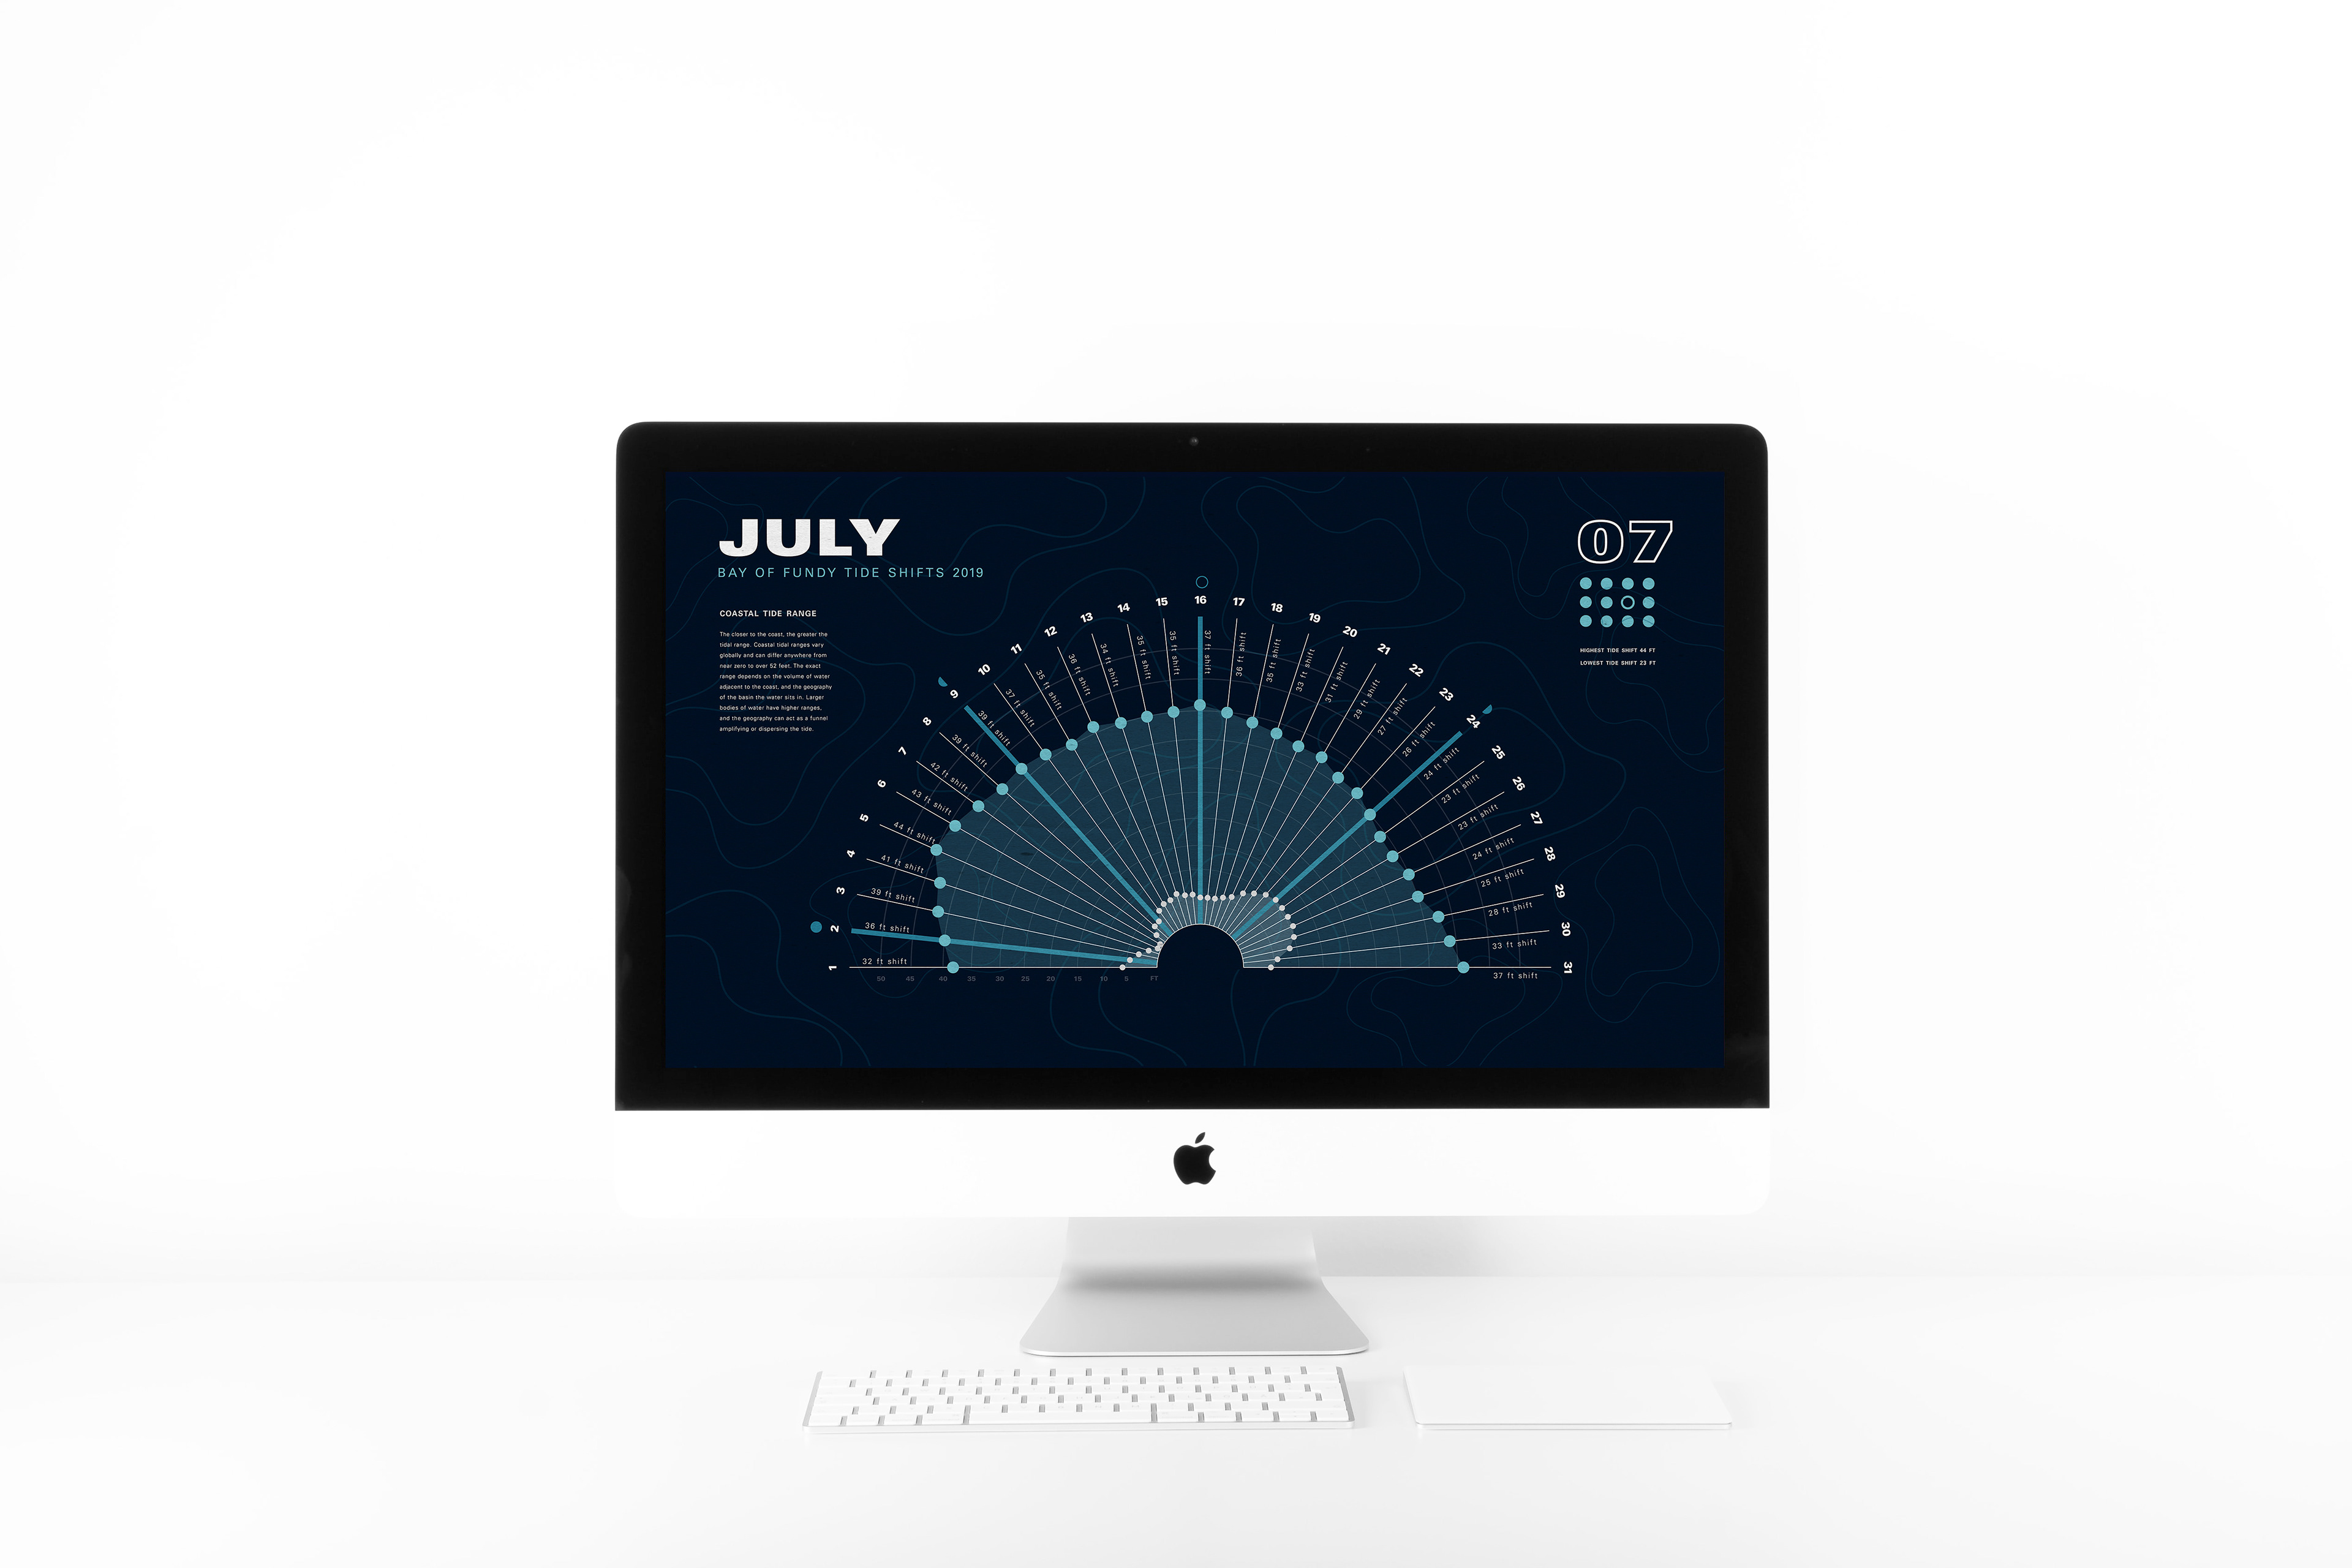
Collected information regarding the Bay of Fundy and visually communicated the tide shifts in conjunction with research supporting why they are so vast. For the main infographic, the tide shifts were observed from the year of 2019 on dates that coincided with changing stages of the moon. The subset slides observe the data on a more in depth basis, looking at tide shifts everyday of the given month.